HUB Datacube Cookbook
General
Is HUB Datacube installed
Imports HUB Datacube and exits the program if the modules are not found.
import sys
try:
    import hubdc.core, hubdc.applier
except:
    sys.exit('ERROR: cannot find HUB Datacube modules')
Is the testdata installed
In this guide we use the EnMAP-Box testdata (https://bitbucket.org/hu-geomatics/enmap-box-testdata).
import sys
try:
    import enmapboxtestdata
except:
    sys.exit('ERROR: cannot find EnMAP-Box Testdata modules')
Is QGIS installed (optional)
We use QGIS 3 map canvas for quick looks (https://qgis.org).
try:
    import qgis, qgis.core, qgis.gui
except:
    exit('ERROR: cannot find QGIS modules')
Check versions installed
import hubdc
import enmapboxtestdata
import qgis.utils
print(hubdc.__version__)
print(enmapboxtestdata.__version__)
print(qgis.utils.Qgis.QGIS_VERSION)
0.16.0
0.9
3.4.3-Madeira
Raster dataset
Find API reference here: hubdc.core.RasterDataset
Open a raster dataset from file
import enmapboxtestdata
from hubdc.core import *

rasterDataset = openRasterDataset(filename=enmapboxtestdata.enmap)
print(rasterDataset)
Prints something like:
RasterDataset(gdalDataset=<osgeo.gdal.Dataset; proxy of <Swig Object of type 'GDALDatasetShadow *' at 0x000001CD7B004AE0> >)
Open a raster dataset from GDAL dataset
import enmapboxtestdata
from hubdc.core import *
from osgeo import gdal

# init with GDAL Dataset
gdalDataset = gdal.Open(enmapboxtestdata.enmap)
rasterDataset = RasterDataset(gdalDataset=gdalDataset)
print(rasterDataset)

# get the GDAL Dataset handle from a RasterDataset
print(rasterDataset.gdalDataset())
Prints something like:
RasterDataset(gdalDataset=<osgeo.gdal.Dataset; proxy of <Swig Object of type 'GDALDatasetShadow *' at 0x00000110C38B4B40> >)
<osgeo.gdal.Dataset; proxy of <Swig Object of type 'GDALDatasetShadow *' at 0x00000110C38B4B40> >
Close a raster dataset
Closing a raster dataset is useful in the middle of a script, to recover the resources held by accessing the dataset, remove file locks, etc. It is not necessary at the end of the script, as the Python garbage collector will do the same thing automatically when the script exits.
import enmapboxtestdata
from hubdc.core import *

rasterDataset = openRasterDataset(filename=enmapboxtestdata.enmap)
rasterDataset.close()
print(rasterDataset)
Prints:
RasterDataset(gdalDataset=None)
Get raster metadata
import enmapboxtestdata
from hubdc.core import *

rasterDataset = openRasterDataset(filename=enmapboxtestdata.enmap)

# get all domains
print('All domains:')
print(rasterDataset.metadataDict())

# get ENVI domain
print('ENVI domain:')
print(rasterDataset.metadataDomain(domain='ENVI'))

# get single item (list with wavelength casted to float)
print('ENVI wavelength:' )
print(rasterDataset.metadataItem(key='wavelength', domain='ENVI', dtype=float))
Prints:
All domains:
{'IMAGE_STRUCTURE':
    {
    'INTERLEAVE': 'BAND'
    },
 'ENVI':
    {
    'bands': '177',
    'band names': ['band 8', 'band 9', 'band 10', 'band 11', 'band 12', 'band 13', 'band 14', 'band 15', 'band 16', 'band 17', 'band 18', 'band 19', 'band 20', 'band 21', 'band 22', 'band 23', 'band 24', 'band 25', 'band 26', 'band 27', 'band 28', 'band 29', 'band 30', 'band 31', 'band 32', 'band 33', 'band 34', 'band 35', 'band 36', 'band 37', 'band 38', 'band 39', 'band 40', 'band 41', 'band 42', 'band 43', 'band 44', 'band 45', 'band 46', 'band 47', 'band 48', 'band 49', 'band 50', 'band 51', 'band 52', 'band 53', 'band 54', 'band 55', 'band 56', 'band 57', 'band 58', 'band 59', 'band 60', 'band 61', 'band 62', 'band 63', 'band 64', 'band 65', 'band 66', 'band 67', 'band 68', 'band 69', 'band 70', 'band 71', 'band 72', 'band 73', 'band 74', 'band 75', 'band 76', 'band 77', 'band 91', 'band 92', 'band 93', 'band 94', 'band 95', 'band 96', 'band 97', 'band 98', 'band 99', 'band 100', 'band 101', 'band 102', 'band 103', 'band 104', 'band 105', 'band 106', 'band 107', 'band 108', 'band 109', 'band 110', 'band 111', 'band 112', 'band 113', 'band 114', 'band 115', 'band 116', 'band 117', 'band 118', 'band 119', 'band 120', 'band 121', 'band 122', 'band 123', 'band 124', 'band 125', 'band 126', 'band 127', 'band 144', 'band 145', 'band 146', 'band 147', 'band 148', 'band 149', 'band 150', 'band 151', 'band 152', 'band 153', 'band 154', 'band 155', 'band 156', 'band 157', 'band 158', 'band 159', 'band 160', 'band 161', 'band 162', 'band 163', 'band 164', 'band 165', 'band 166', 'band 167', 'band 168', 'band 195', 'band 196', 'band 197', 'band 198', 'band 199', 'band 200', 'band 201', 'band 202', 'band 203', 'band 204', 'band 205', 'band 206', 'band 207', 'band 208', 'band 209', 'band 210', 'band 211', 'band 212', 'band 213', 'band 214', 'band 215', 'band 216', 'band 217', 'band 218', 'band 219', 'band 220', 'band 221', 'band 222', 'band 223', 'band 224', 'band 225', 'band 226', 'band 227', 'band 228', 'band 229', 'band 230', 'band 231', 'band 232', 'band 233', 'band 234', 'band 235', 'band 236', 'band 237', 'band 238', 'band 239'],
    'byte order': '0',
    'coordinate system string': ['PROJCS["UTM_Zone_33N"', 'GEOGCS["GCS_WGS_1984"', 'DATUM["D_WGS_1984"', 'SPHEROID["WGS_1984"', '6378137.0', '298.257223563]]', 'PRIMEM["Greenwich"', '0.0]', 'UNIT["Degree"', '0.0174532925199433]]', 'PROJECTION["Transverse_Mercator"]', 'PARAMETER["False_Easting"', '500000.0]', 'PARAMETER["False_Northing"', '0.0]', 'PARAMETER["Central_Meridian"', '15.0]', 'PARAMETER["Scale_Factor"', '0.9996]', 'PARAMETER["Latitude_Of_Origin"', '0.0]', 'UNIT["Meter"', '1.0]]'],
    'data ignore value': '-99',
    'data type': '2',
    'description': ['EnMAP02_Berlin_Urban_Gradient_2009.bsq', 'http://doi.org/10.5880/enmap.2016.008', 'spectral and spatial subset'],
    'file compression': '1',
    'file type': 'ENVI Standard',
    'fwhm': ['0.005800', '0.005800', '0.005800', '0.005800', '0.005800', '0.005800', '0.005800', '0.005800', '0.005800', '0.005800', '0.005900', '0.005900', '0.006000', '0.006000', '0.006100', '0.006100', '0.006200', '0.006200', '0.006300', '0.006400', '0.006400', '0.006500', '0.006600', '0.006600', '0.006700', '0.006800', '0.006900', '0.006900', '0.007000', '0.007100', '0.007200', '0.007300', '0.007300', '0.007400', '0.007500', '0.007600', '0.007700', '0.007800', '0.007900', '0.007900', '0.008000', '0.008100', '0.008200', '0.008300', '0.008400', '0.008400', '0.008500', '0.008600', '0.008700', '0.008700', '0.008800', '0.008900', '0.008900', '0.009000', '0.009100', '0.009100', '0.009200', '0.009300', '0.009300', '0.009400', '0.009400', '0.009500', '0.009500', '0.009600', '0.009600', '0.009600', '0.009600', '0.009700', '0.009700', '0.009700', '0.011800', '0.011900', '0.012100', '0.012200', '0.012400', '0.012500', '0.012700', '0.012800', '0.012900', '0.013100', '0.013200', '0.013300', '0.013400', '0.013500', '0.013600', '0.013700', '0.013800', '0.013900', '0.014000', '0.014000', '0.014100', '0.014100', '0.014200', '0.014200', '0.014300', '0.014300', '0.014300', '0.014400', '0.014400', '0.014400', '0.014400', '0.014400', '0.014400', '0.014400', '0.014400', '0.014400', '0.014400', '0.013700', '0.013600', '0.013600', '0.013500', '0.013500', '0.013400', '0.013400', '0.013300', '0.013200', '0.013200', '0.013100', '0.013100', '0.013000', '0.012900', '0.012900', '0.012800', '0.012800', '0.012700', '0.012700', '0.012600', '0.012500', '0.012500', '0.012400', '0.012400', '0.012300', '0.010900', '0.010800', '0.010800', '0.010700', '0.010700', '0.010600', '0.010600', '0.010500', '0.010500', '0.010400', '0.010400', '0.010400', '0.010300', '0.010300', '0.010200', '0.010200', '0.010100', '0.010100', '0.010100', '0.010000', '0.010000', '0.009900', '0.009900', '0.009900', '0.009800', '0.009800', '0.009700', '0.009700', '0.009700', '0.009600', '0.009600', '0.009600', '0.009500', '0.009500', '0.009400', '0.009400', '0.009400', '0.009300', '0.009300', '0.009300', '0.009200', '0.009200', '0.009100', '0.009100', '0.009100'],
    'header offset': '0',
    'interleave': 'bsq',
    'lines': '400',
    'samples': '220',
    'sensor type': 'Unknown',
    'wavelength': ['0.460000', '0.465000', '0.470000', '0.475000', '0.479000', '0.484000', '0.489000', '0.494000', '0.499000', '0.503000', '0.508000', '0.513000', '0.518000', '0.523000', '0.528000', '0.533000', '0.538000', '0.543000', '0.549000', '0.554000', '0.559000', '0.565000', '0.570000', '0.575000', '0.581000', '0.587000', '0.592000', '0.598000', '0.604000', '0.610000', '0.616000', '0.622000', '0.628000', '0.634000', '0.640000', '0.646000', '0.653000', '0.659000', '0.665000', '0.672000', '0.679000', '0.685000', '0.692000', '0.699000', '0.706000', '0.713000', '0.720000', '0.727000', '0.734000', '0.741000', '0.749000', '0.756000', '0.763000', '0.771000', '0.778000', '0.786000', '0.793000', '0.801000', '0.809000', '0.817000', '0.824000', '0.832000', '0.840000', '0.848000', '0.856000', '0.864000', '0.872000', '0.880000', '0.888000', '0.896000', '0.915000', '0.924000', '0.934000', '0.944000', '0.955000', '0.965000', '0.975000', '0.986000', '0.997000', '1.007000', '1.018000', '1.029000', '1.040000', '1.051000', '1.063000', '1.074000', '1.086000', '1.097000', '1.109000', '1.120000', '1.132000', '1.144000', '1.155000', '1.167000', '1.179000', '1.191000', '1.203000', '1.215000', '1.227000', '1.239000', '1.251000', '1.263000', '1.275000', '1.287000', '1.299000', '1.311000', '1.323000', '1.522000', '1.534000', '1.545000', '1.557000', '1.568000', '1.579000', '1.590000', '1.601000', '1.612000', '1.624000', '1.634000', '1.645000', '1.656000', '1.667000', '1.678000', '1.689000', '1.699000', '1.710000', '1.721000', '1.731000', '1.742000', '1.752000', '1.763000', '1.773000', '1.783000', '2.044000', '2.053000', '2.062000', '2.071000', '2.080000', '2.089000', '2.098000', '2.107000', '2.115000', '2.124000', '2.133000', '2.141000', '2.150000', '2.159000', '2.167000', '2.176000', '2.184000', '2.193000', '2.201000', '2.210000', '2.218000', '2.226000', '2.234000', '2.243000', '2.251000', '2.259000', '2.267000', '2.275000', '2.283000', '2.292000', '2.300000', '2.308000', '2.315000', '2.323000', '2.331000', '2.339000', '2.347000', '2.355000', '2.363000', '2.370000', '2.378000', '2.386000', '2.393000', '2.401000', '2.409000'],
    'wavelength units': 'Micrometers',
    'y start': '24',
    'z plot titles': ['wavelength [!7l!3m]!N', 'reflectance [*10000]']
    }
}

ENVI domain:
{
'bands': '177',
...
'z plot titles': ['wavelength [!7l!3m]!N', 'reflectance [*10000]']
}

ENVI wavelength:
[0.46, 0.465, 0.47, 0.475, 0.479, 0.484, 0.489, 0.494, 0.499, 0.503, 0.508, 0.513, 0.518, 0.523, 0.528, 0.533, 0.538, 0.543, 0.549, 0.554, 0.559, 0.565, 0.57, 0.575, 0.581, 0.587, 0.592, 0.598, 0.604, 0.61, 0.616, 0.622, 0.628, 0.634, 0.64, 0.646, 0.653, 0.659, 0.665, 0.672, 0.679, 0.685, 0.692, 0.699, 0.706, 0.713, 0.72, 0.727, 0.734, 0.741, 0.749, 0.756, 0.763, 0.771, 0.778, 0.786, 0.793, 0.801, 0.809, 0.817, 0.824, 0.832, 0.84, 0.848, 0.856, 0.864, 0.872, 0.88, 0.888, 0.896, 0.915, 0.924, 0.934, 0.944, 0.955, 0.965, 0.975, 0.986, 0.997, 1.007, 1.018, 1.029, 1.04, 1.051, 1.063, 1.074, 1.086, 1.097, 1.109, 1.12, 1.132, 1.144, 1.155, 1.167, 1.179, 1.191, 1.203, 1.215, 1.227, 1.239, 1.251, 1.263, 1.275, 1.287, 1.299, 1.311, 1.323, 1.522, 1.534, 1.545, 1.557, 1.568, 1.579, 1.59, 1.601, 1.612, 1.624, 1.634, 1.645, 1.656, 1.667, 1.678, 1.689, 1.699, 1.71, 1.721, 1.731, 1.742, 1.752, 1.763, 1.773, 1.783, 2.044, 2.053, 2.062, 2.071, 2.08, 2.089, 2.098, 2.107, 2.115, 2.124, 2.133, 2.141, 2.15, 2.159, 2.167, 2.176, 2.184, 2.193, 2.201, 2.21, 2.218, 2.226, 2.234, 2.243, 2.251, 2.259, 2.267, 2.275, 2.283, 2.292, 2.3, 2.308, 2.315, 2.323, 2.331, 2.339, 2.347, 2.355, 2.363, 2.37, 2.378, 2.386, 2.393, 2.401, 2.409]
Set raster metadata
import enmapboxtestdata
from hubdc.core import *

rasterDataset = openRasterDataset(filename=enmapboxtestdata.enmap)

# set multiple domains
copy = rasterDataset.translate()
copy.setMetadataDict(metadataDict={'domain1': {'a': 1, 'b': 2},
                                   'domain2': {'c': 3, 'd': 4}})
print({domain: copy.metadataDict()[domain] for domain in ['domain1', 'domain2']})

# set domain
copy = rasterDataset.translate()
copy.setMetadataDomain(metadataDomain={'a': 1, 'b': 2}, domain='domain')
print(copy.metadataDict()['domain'])

# set item
copy = rasterDataset.translate()
copy.setMetadataItem(key='a', value=1, domain='domain')
print(copy.metadataDict()['domain'])
Prints:
{'domain1': {'a': '1', 'b': '2'}, 'domain2': {'c': '3', 'd': '4'}}
{'a': '1', 'b': '2'}
{'a': '1'}
Get and set no data value
Warning
todo
Get raster band
import enmapboxtestdata
from hubdc.core import *

rasterDataset = openRasterDataset(filename=enmapboxtestdata.enmap)
rasterBandDataset = rasterDataset.band(index=0)
print(rasterBandDataset)
Prints:
RasterBandDataset(raster=RasterDataset(gdalDataset=<osgeo.gdal.Dataset; proxy of <Swig Object of type 'GDALDatasetShadow *' at 0x000001A6FFF34B40> >), index=0)
Read raster data
import enmapboxtestdata
from hubdc.core import *

rasterDataset = openRasterDataset(filename=enmapboxtestdata.enmap)

# read dataset

# - all bands as 3d array
print(rasterDataset.readAsArray().shape)
# - single band as 2d array
print(rasterDataset.band(index=0).readAsArray().shape)
# - pixel (z) profile as 1d array
print(rasterDataset.zprofile(pixel=Pixel(x=100, y=100)).shape)
# - column (x) profile as 1d array
print(rasterDataset.xprofile(row=Row(y=100, z=0)).shape)
# - row (y) profile as 1d array
print(rasterDataset.yprofile(column=Column(x=100, z=0)).shape)

# read dataset for given target grid (may include on-the-fly resampling and/or reprojection)

grid = Grid(extent=Extent(xmin=13, xmax=13.5, ymin=52, ymax=52.5, projection=Projection.wgs84()), resolution=0.001)
# - all bands as 3d array
print(rasterDataset.array(grid=grid, resampleAlg=gdal.GRA_Cubic).shape)
# - single band as 2d array
print(rasterDataset.band(index=0).array(grid=grid, resampleAlg=gdal.GRA_Cubic).shape)
Prints:
(177, 400, 220)
(400, 220)
(177,)
(220,)
(400,)
(177, 500, 500)
(500, 500)
Write raster data
Warning
todo
Loop through all raster bands
import enmapboxtestdata
from hubdc.core import *

rasterDataset = openRasterDataset(filename=enmapboxtestdata.enmap)
for band in rasterDataset.bands():
    array = band.readAsArray()
    noDataValue = band.noDataValue()
    values = array[array != noDataValue]
    min = values.min()
    max = values.max()
    mean = values.std()
    print('Band {} Stats: Minimum={}, Maximum={}, Mean={}'.format(band.index()+1, min, max, mean))
Prints:
Band 1 Stats: Minimum=110, Maximum=3759, Mean=212.88073662811726
Band 2 Stats: Minimum=105, Maximum=3757, Mean=214.96880571233484
Band 3 Stats: Minimum=96, Maximum=3792, Mean=217.37383030398556
...
Convert a vector to a raster
import enmapboxtestdata
from hubdc.core import *

vectorDataset = openVectorDataset(filename=enmapboxtestdata.landcover_polygons)
grid = vectorDataset.grid(resolution=5)
rasterDataset = vectorDataset.rasterize(grid, noDataValue=-9999, initValue=-9999,
                                        burnAttribute='level_3_id',
                                        filename='raster.tif', driver=GTiffDriver())
Clip a raster with a vector
Clip a raster with the extent from a vector.
import enmapboxtestdata
from hubdc.core import *

rasterDataset = openRasterDataset(filename=enmapboxtestdata.enmap)
vectorDataset = openVectorDataset(filename=enmapboxtestdata.landcover_polygons)
grid = rasterDataset.grid().clip(extent=vectorDataset.extent())
clipped = rasterDataset.translate(grid=grid, filename='raster.tif', driver=GTiffDriver())
Note that the result raster grid is snapped to the original raster grid to prevent subpixel shifts. Because of this, some vector geometries may slightly lap over the grid borders.
Calculate zonal statistics
Calculates statistics on values (i.e. mean value) of a raster band within the zones given by a vector attribute.
In this example we use the level_3_id attribute as zones.
import enmapboxtestdata
from hubdc.core import *
import numpy as np

rasterDataset = openRasterDataset(filename=enmapboxtestdata.enmap)
vectorDataset = openVectorDataset(filename=enmapboxtestdata.landcover_polygons)

# rasterize zones attribute
zonesRasterDataset = vectorDataset.rasterize(grid=rasterDataset.grid(),
                                             burnAttribute='level_3_id')

# calculate zonal statistics for the first raster band
values = rasterDataset.band(index=0).readAsArray()
zones = zonesRasterDataset.band(index=0).readAsArray()

for i in np.unique(zones):
    mean = np.mean(values[zones == i]) # subset pixels for current zone and calculate mean
    print('Zone {} mean: {}'.format(i+1, mean))
Prints:
Zone 1.0 mean: 331.07156981342763
Zone 2.0 mean: 546.2222222222222
Zone 3.0 mean: 546.7610921501706
Zone 4.0 mean: 387.565625
Zone 5.0 mean: 365.40816326530614
Zone 6.0 mean: 838.8627450980392
Zone 7.0 mean: 191.05405405405406
Create raster from array
from hubdc.core import *
import numpy as np

array = np.array([[ 1, 1, 1, 1, 1, 1, 1, 1, 1, 1, 1],
                  [ 1, 0, 1, 1, 0, 1, 0, 1, 1, 0, 1],
                  [ 1, 0, 1, 1, 0, 1, 0, 1, 1, 0, 1],
                  [ 1, 0, 0, 0, 0, 1, 0, 1, 1, 0, 1],
                  [ 1, 0, 1, 1, 0, 1, 0, 1, 1, 0, 1],
                  [ 1, 0, 1, 1, 0, 1, 0, 0, 0, 0, 1],
                  [ 1, 1, 1, 1, 1, 1, 1, 1, 1, 1, 1]])

rasterDataset = RasterDataset.fromArray(array=array, filename='raster.tif', driver=GTiffDriver())

Create memory raster
Copy a raster into memory.
import enmapboxtestdata
from hubdc.core import *

rasterDataset = openRasterDataset(enmapboxtestdata.enmap)

# option a) with MemDriver
driver = MemDriver()
copy = rasterDataset.translate(driver=driver)

# option b) with in-memory files and any driver
driver = GTiffDriver()
options = [driver.Option.INTERLEAVE.BAND, driver.Option.COMPRESS.LZW]
copy = rasterDataset.translate(filename='/vsimem/raster.tif', driver=driver, options=options)
Replace no data value of raster with new value
import enmapboxtestdata
from hubdc.core import *

rasterDataset = openRasterDataset(filename=enmapboxtestdata.enmap)

# read data
array = rasterDataset.readAsArray()

# replace no data value
oldNoDataValue = rasterDataset.noDataValue()
newNoDataValue = -1
array[array==oldNoDataValue] = newNoDataValue

# write data
newRasterDataset = RasterDataset.fromArray(array=array, grid=rasterDataset.grid(),
                                           filename='raster.tif', driver=GTiffDriver())
newRasterDataset.setNoDataValue(value=newNoDataValue)
Raster band dataset
Get raster band information
import enmapboxtestdata
from hubdc.core import *

rasterDataset = openRasterDataset(filename=enmapboxtestdata.createClassification(30))
rasterBand = rasterDataset.band(index=0)
print('no data value: {}'.format(rasterBand.noDataValue()))
print('description: {}'.format(rasterBand.description()))
print('category names: {}'.format(rasterBand.categoryNames()))
print('category colors: {}'.format(rasterBand.categoryColors()))
Prints:
no data value: 0.0
description: Classification
category names: ['unclassified', 'impervious', 'low vegetation', 'tree', 'soil', 'water']
category colors: [(0, 0, 0, 255), (230, 0, 0, 255), (152, 230, 0, 255), (38, 115, 0, 255), (168, 112, 0, 255), (0, 100, 255, 255)]
Set raster band category names and colors
from hubdc.core import *

rasterDataset = RasterDataset.fromArray(array=[[[0, 1, 2, 3]]], filename='raster.bsq', driver=EnviDriver())
band = rasterDataset.band(index=0)
band.setCategoryNames(names=['unclassified', 'class 1', 'class 2', 'class 3'])
band.setCategoryColors(colors=[(0,0,0), (255, 0, 0), (0, 255, 0), (0, 0, 255)]) # list of rgb or rgba tuples
print(band.categoryNames())
print(band.categoryColors())
Prints:
['unclassified', 'class 1', 'class 2', 'class 3']
[(0, 0, 0, 255), (255, 0, 0, 255), (0, 255, 0, 255), (0, 0, 255, 255)]
| ..... | Classes |
|---|---|
| class 1 | |
| class 2 | |
| class 3 |

Grid
Create grid
from hubflow.core import *

# create a grid in WGS84 for the whole world with 1 degree resolution
extent=Extent(xmin=-180.0, ymin=-90.0, xmax=180.0, ymax=90.0, projection=Projection.wgs84())
grid = Grid(extent=extent, resolution=1.0)
print(grid)
Prints:
Grid(extent=Extent(xmin=-180.0, xmax=180.0, ymin=-90.0, ymax=90.0, projection=Projection(wkt=GEOGCS["WGS 84", DATUM["WGS_1984", SPHEROID["WGS 84",6378137,298.257223563, AUTHORITY["EPSG","7030"]], AUTHORITY["EPSG","6326"]], PRIMEM["Greenwich",0, AUTHORITY["EPSG","8901"]], UNIT["degree",0.0174532925199433, AUTHORITY["EPSG","9122"]], AUTHORITY["EPSG","4326"]])), resolution=Resolution(x=1.0, y=1.0), projection=Projection(wkt=GEOGCS["WGS 84", DATUM["WGS_1984", SPHEROID["WGS 84",6378137,298.257223563, AUTHORITY["EPSG","7030"]], AUTHORITY["EPSG","6326"]], PRIMEM["Greenwich",0, AUTHORITY["EPSG","8901"]], UNIT["degree",0.0174532925199433, AUTHORITY["EPSG","9122"]], AUTHORITY["EPSG","4326"]])
Get grid information
print(grid.shape())
print(grid.size())
print(grid.geoTransform())
Prints:
(180, 360)
RasterSize(x=360, y=180)
(-180.0, 1.0, 0.0, 90.0, 0.0, -1.0)
Subset grid by pixel offset and size
subgrid = grid.subset(offset=(0, 0), size=(10, 10))
print(subgrid)
print(subgrid.size())
Prints:
Grid(extent=Extent(xmin=-180.0, xmax=-170.0, ymin=80.0, ymax=90.0, projection=Projection(wkt=GEOGCS["WGS 84",     DATUM["WGS_1984",         SPHEROID["WGS 84",6378137,298.257223563,             AUTHORITY["EPSG","7030"]],         AUTHORITY["EPSG","6326"]],     PRIMEM["Greenwich",0,         AUTHORITY["EPSG","8901"]],     UNIT["degree",0.0174532925199433,         AUTHORITY["EPSG","9122"]],     AUTHORITY["EPSG","4326"]])), resolution=Resolution(x=1.0, y=1.0), projection=Projection(wkt=GEOGCS["WGS 84",     DATUM["WGS_1984",         SPHEROID["WGS 84",6378137,298.257223563,             AUTHORITY["EPSG","7030"]],         AUTHORITY["EPSG","6326"]],     PRIMEM["Greenwich",0,         AUTHORITY["EPSG","8901"]],     UNIT["degree",0.0174532925199433,         AUTHORITY["EPSG","9122"]],     AUTHORITY["EPSG","4326"]])
RasterSize(x=10, y=10)
Create systematic subgrids (tiling scheme)
subgrids = grid.subgrids(size=(90, 90))
for subgrid, i, iy, ix in subgrids:
    print('x{}, y{}: {}'.format(ix, iy, subgrid))
Prints:
x0, y0: Grid(extent=Extent(xmin=-180.0, xmax=-90.0, ymin=0.0, ymax=90.0, projection=Projection(wkt=GEOGCS["WGS 84",     DATUM["WGS_1984",         SPHEROID["WGS 84",6378137,298.257223563,             AUTHORITY["EPSG","7030"]],         AUTHORITY["EPSG","6326"]],     PRIMEM["Greenwich",0,         AUTHORITY["EPSG","8901"]],     UNIT["degree",0.0174532925199433,         AUTHORITY["EPSG","9122"]],     AUTHORITY["EPSG","4326"]])), resolution=Resolution(x=1.0, y=1.0), projection=Projection(wkt=GEOGCS["WGS 84",     DATUM["WGS_1984",         SPHEROID["WGS 84",6378137,298.257223563,             AUTHORITY["EPSG","7030"]],         AUTHORITY["EPSG","6326"]],     PRIMEM["Greenwich",0,         AUTHORITY["EPSG","8901"]],     UNIT["degree",0.0174532925199433,         AUTHORITY["EPSG","9122"]],     AUTHORITY["EPSG","4326"]])
x1, y0: Grid(extent=Extent(xmin=-90.0, xmax=0.0, ymin=0.0, ymax=90.0, projection=Projection(wkt=GEOGCS["WGS 84",     DATUM["WGS_1984",         SPHEROID["WGS 84",6378137,298.257223563,             AUTHORITY["EPSG","7030"]],         AUTHORITY["EPSG","6326"]],     PRIMEM["Greenwich",0,         AUTHORITY["EPSG","8901"]],     UNIT["degree",0.0174532925199433,         AUTHORITY["EPSG","9122"]],     AUTHORITY["EPSG","4326"]])), resolution=Resolution(x=1.0, y=1.0), projection=Projection(wkt=GEOGCS["WGS 84",     DATUM["WGS_1984",         SPHEROID["WGS 84",6378137,298.257223563,             AUTHORITY["EPSG","7030"]],         AUTHORITY["EPSG","6326"]],     PRIMEM["Greenwich",0,         AUTHORITY["EPSG","8901"]],     UNIT["degree",0.0174532925199433,         AUTHORITY["EPSG","9122"]],     AUTHORITY["EPSG","4326"]])
x2, y0: Grid(extent=Extent(xmin=0.0, xmax=90.0, ymin=0.0, ymax=90.0, projection=Projection(wkt=GEOGCS["WGS 84",     DATUM["WGS_1984",         SPHEROID["WGS 84",6378137,298.257223563,             AUTHORITY["EPSG","7030"]],         AUTHORITY["EPSG","6326"]],     PRIMEM["Greenwich",0,         AUTHORITY["EPSG","8901"]],     UNIT["degree",0.0174532925199433,         AUTHORITY["EPSG","9122"]],     AUTHORITY["EPSG","4326"]])), resolution=Resolution(x=1.0, y=1.0), projection=Projection(wkt=GEOGCS["WGS 84",     DATUM["WGS_1984",         SPHEROID["WGS 84",6378137,298.257223563,             AUTHORITY["EPSG","7030"]],         AUTHORITY["EPSG","6326"]],     PRIMEM["Greenwich",0,         AUTHORITY["EPSG","8901"]],     UNIT["degree",0.0174532925199433,         AUTHORITY["EPSG","9122"]],     AUTHORITY["EPSG","4326"]])
x3, y0: Grid(extent=Extent(xmin=90.0, xmax=180.0, ymin=0.0, ymax=90.0, projection=Projection(wkt=GEOGCS["WGS 84",     DATUM["WGS_1984",         SPHEROID["WGS 84",6378137,298.257223563,             AUTHORITY["EPSG","7030"]],         AUTHORITY["EPSG","6326"]],     PRIMEM["Greenwich",0,         AUTHORITY["EPSG","8901"]],     UNIT["degree",0.0174532925199433,         AUTHORITY["EPSG","9122"]],     AUTHORITY["EPSG","4326"]])), resolution=Resolution(x=1.0, y=1.0), projection=Projection(wkt=GEOGCS["WGS 84",     DATUM["WGS_1984",         SPHEROID["WGS 84",6378137,298.257223563,             AUTHORITY["EPSG","7030"]],         AUTHORITY["EPSG","6326"]],     PRIMEM["Greenwich",0,         AUTHORITY["EPSG","8901"]],     UNIT["degree",0.0174532925199433,         AUTHORITY["EPSG","9122"]],     AUTHORITY["EPSG","4326"]])
x0, y1: Grid(extent=Extent(xmin=-180.0, xmax=-90.0, ymin=-90.0, ymax=0.0, projection=Projection(wkt=GEOGCS["WGS 84",     DATUM["WGS_1984",         SPHEROID["WGS 84",6378137,298.257223563,             AUTHORITY["EPSG","7030"]],         AUTHORITY["EPSG","6326"]],     PRIMEM["Greenwich",0,         AUTHORITY["EPSG","8901"]],     UNIT["degree",0.0174532925199433,         AUTHORITY["EPSG","9122"]],     AUTHORITY["EPSG","4326"]])), resolution=Resolution(x=1.0, y=1.0), projection=Projection(wkt=GEOGCS["WGS 84",     DATUM["WGS_1984",         SPHEROID["WGS 84",6378137,298.257223563,             AUTHORITY["EPSG","7030"]],         AUTHORITY["EPSG","6326"]],     PRIMEM["Greenwich",0,         AUTHORITY["EPSG","8901"]],     UNIT["degree",0.0174532925199433,         AUTHORITY["EPSG","9122"]],     AUTHORITY["EPSG","4326"]])
x1, y1: Grid(extent=Extent(xmin=-90.0, xmax=0.0, ymin=-90.0, ymax=0.0, projection=Projection(wkt=GEOGCS["WGS 84",     DATUM["WGS_1984",         SPHEROID["WGS 84",6378137,298.257223563,             AUTHORITY["EPSG","7030"]],         AUTHORITY["EPSG","6326"]],     PRIMEM["Greenwich",0,         AUTHORITY["EPSG","8901"]],     UNIT["degree",0.0174532925199433,         AUTHORITY["EPSG","9122"]],     AUTHORITY["EPSG","4326"]])), resolution=Resolution(x=1.0, y=1.0), projection=Projection(wkt=GEOGCS["WGS 84",     DATUM["WGS_1984",         SPHEROID["WGS 84",6378137,298.257223563,             AUTHORITY["EPSG","7030"]],         AUTHORITY["EPSG","6326"]],     PRIMEM["Greenwich",0,         AUTHORITY["EPSG","8901"]],     UNIT["degree",0.0174532925199433,         AUTHORITY["EPSG","9122"]],     AUTHORITY["EPSG","4326"]])
x2, y1: Grid(extent=Extent(xmin=0.0, xmax=90.0, ymin=-90.0, ymax=0.0, projection=Projection(wkt=GEOGCS["WGS 84",     DATUM["WGS_1984",         SPHEROID["WGS 84",6378137,298.257223563,             AUTHORITY["EPSG","7030"]],         AUTHORITY["EPSG","6326"]],     PRIMEM["Greenwich",0,         AUTHORITY["EPSG","8901"]],     UNIT["degree",0.0174532925199433,         AUTHORITY["EPSG","9122"]],     AUTHORITY["EPSG","4326"]])), resolution=Resolution(x=1.0, y=1.0), projection=Projection(wkt=GEOGCS["WGS 84",     DATUM["WGS_1984",         SPHEROID["WGS 84",6378137,298.257223563,             AUTHORITY["EPSG","7030"]],         AUTHORITY["EPSG","6326"]],     PRIMEM["Greenwich",0,         AUTHORITY["EPSG","8901"]],     UNIT["degree",0.0174532925199433,         AUTHORITY["EPSG","9122"]],     AUTHORITY["EPSG","4326"]])
x3, y1: Grid(extent=Extent(xmin=90.0, xmax=180.0, ymin=-90.0, ymax=0.0, projection=Projection(wkt=GEOGCS["WGS 84",     DATUM["WGS_1984",         SPHEROID["WGS 84",6378137,298.257223563,             AUTHORITY["EPSG","7030"]],         AUTHORITY["EPSG","6326"]],     PRIMEM["Greenwich",0,         AUTHORITY["EPSG","8901"]],     UNIT["degree",0.0174532925199433,         AUTHORITY["EPSG","9122"]],     AUTHORITY["EPSG","4326"]])), resolution=Resolution(x=1.0, y=1.0), projection=Projection(wkt=GEOGCS["WGS 84",     DATUM["WGS_1984",         SPHEROID["WGS 84",6378137,298.257223563,             AUTHORITY["EPSG","7030"]],         AUTHORITY["EPSG","6326"]],     PRIMEM["Greenwich",0,         AUTHORITY["EPSG","8901"]],     UNIT["degree",0.0174532925199433,         AUTHORITY["EPSG","9122"]],     AUTHORITY["EPSG","4326"]])
Anchor a grid to a point
from hubflow.core import *
import enmapboxtestdata

# Get raster grid.
rasterDataset = openRasterDataset(enmapboxtestdata.enmap)
print(rasterDataset.grid())

# Reproject that grid into WGS84 with 0.005 degree resolution.
extentWgs84 = rasterDataset.grid().extent().reproject(projection=Projection.wgs84())
gridWgs84 = Grid(extent=extentWgs84, resolution=0.005)
print(gridWgs84)

# Anchor the grid to (0, 0) degrees.
# This ensures that the upper left and lower right point coordinates are multiples of the 0.005 degree resolution

gridWgs84Anchored = gridWgs84.anchor(Point(x=0, y=0, projection=Projection.wgs84()))
print(gridWgs84Anchored)
Prints:
Get grid coordinates
from hubflow.core import *

extent=Extent(xmin=-180.0, ymin=-90.0, xmax=180.0, ymax=90.0, projection=Projection.wgs84())
grid = Grid(extent=extent, resolution=10)
print(grid)
print(grid.size())

# Get x center coordinats.
print(grid.xMapCoordinates())

# Get y center coordinats.
print(grid.yMapCoordinates())
Prints:
Grid(extent=Extent(xmin=-180.0, xmax=180.0, ymin=-90.0, ymax=90.0, projection=Projection(wkt=GEOGCS["WGS 84",     DATUM["WGS_1984",         SPHEROID["WGS 84",6378137,298.257223563,             AUTHORITY["EPSG","7030"]],         AUTHORITY["EPSG","6326"]],     PRIMEM["Greenwich",0,         AUTHORITY["EPSG","8901"]],     UNIT["degree",0.0174532925199433,         AUTHORITY["EPSG","9122"]],     AUTHORITY["EPSG","4326"]])), resolution=Resolution(x=10.0, y=10.0), projection=Projection(wkt=GEOGCS["WGS 84",     DATUM["WGS_1984",         SPHEROID["WGS 84",6378137,298.257223563,             AUTHORITY["EPSG","7030"]],         AUTHORITY["EPSG","6326"]],     PRIMEM["Greenwich",0,         AUTHORITY["EPSG","8901"]],     UNIT["degree",0.0174532925199433,         AUTHORITY["EPSG","9122"]],     AUTHORITY["EPSG","4326"]])
RasterSize(x=36, y=18)
[-175.0, -165.0, -155.0, -145.0, -135.0, -125.0, -115.0, -105.0, -95.0, -85.0, -75.0, -65.0, -55.0, -45.0, -35.0, -25.0, -15.0, -5.0, 5.0, 15.0, 25.0, 35.0, 45.0, 55.0, 65.0, 75.0, 85.0, 95.0, 105.0, 115.0, 125.0, 135.0, 145.0, 155.0, 165.0, 175.0]
[85.0, 75.0, 65.0, 55.0, 45.0, 35.0, 25.0, 15.0, 5.0, -5.0, -15.0, -25.0, -35.0, -45.0, -55.0, -65.0, -75.0, -85.0]
Extent
Create extent
from hubflow.core import *

# create a extent in WGS84 for the whole world
extent=Extent(xmin=-180.0, ymin=-90.0, xmax=180.0, ymax=90.0, projection=Projection.wgs84())
print(extent)
Prints:
Extent(xmin=-180.0, xmax=180.0, ymin=-90.0, ymax=90.0, projection=Projection(wkt=GEOGCS["WGS 84", DATUM["WGS_1984", SPHEROID["WGS 84",6378137,298.257223563, AUTHORITY["EPSG","7030"]], AUTHORITY["EPSG","6326"]], PRIMEM["Greenwich",0, AUTHORITY["EPSG","8901"]], UNIT["degree",0.0174532925199433, AUTHORITY["EPSG","9122"]], AUTHORITY["EPSG","4326"]]))
Get extent information
Warning
todo
Geometric calculation
Warning
todo
RasterDriver
Create raster driver
from hubdc.core import *

# driver by name
print(RasterDriver(name='GTiff'))

# some predined driver
print(GTiffDriver())
print(EnviDriver())
print(ErdasDriver())

# by file extension
print(RasterDriver.fromFilename('raster.vrt'))
Prints:
RasterDriver(name='GTiff')
GTiffDriver()
EnviDriver()
ErdasDriver()
VrtDriver()
Specify GeoTiff creation options
from hubdc.core import *

driver = GTiffDriver()

# GTiff default options
print(driver.options())

# options for LZW compressed GTiff
print(driver.options() + [driver.Option.COMPRESS.LZW])

# options for JPEG compressed GTiff
print(driver.options() + [driver.Option.COMPRESS.JPEG, driver.Option.JPEG_QUALITY(75)])

# options for tiled GTiff
print(driver.options() + [driver.Option.TILED.YES, driver.Option.BLOCKXSIZE(256), driver.Option.BLOCKYSIZE(256)])
Prints:
['INTERLEAVE=BAND']
['INTERLEAVE=BAND', 'COMPRESS=LZW']
['INTERLEAVE=BAND', 'COMPRESS=JPEG', 'JPEG_QUALITY=75']
['INTERLEAVE=BAND', 'TILED=YES', 'BLOCKXSIZE=256', 'BLOCKYSIZE=256']
Projection
Create projection
from hubdc.core import *

# from well known text
print(Projection(wkt='GEOGCS["WGS84", DATUM["WGS_1984", SPHEROID["WGS84",6378137,298.257223563, AUTHORITY["EPSG","7030"]], AUTHORITY["EPSG","6326"]], PRIMEM["Greenwich",0, AUTHORITY["EPSG","8901"]], UNIT["degree",0.0174532925199433, AUTHORITY["EPSG","9122"]], AUTHORITY["EPSG","4326"]]'))

# from EPSG code
print(Projection.fromEpsg(epsg=4326))

# some predefined projections
print(Projection.wgs84())
print(Projection.wgs84WebMercator())
print(Projection.utm(zone=33, north=True))
print(Projection.utm(zone=33, north=False))
Prints:
Projection(wkt=GEOGCS["WGS84", DATUM["WGS_1984", SPHEROID["WGS84",6378137,298.257223563, AUTHORITY["EPSG","7030"]], AUTHORITY["EPSG","6326"]], PRIMEM["Greenwich",0, AUTHORITY["EPSG","8901"]], UNIT["degree",0.0174532925199433, AUTHORITY["EPSG","9122"]], AUTHORITY["EPSG","4326"]])
Projection(wkt=GEOGCS["WGS 84",     DATUM["WGS_1984",         SPHEROID["WGS 84",6378137,298.257223563,             AUTHORITY["EPSG","7030"]],         AUTHORITY["EPSG","6326"]],     PRIMEM["Greenwich",0,         AUTHORITY["EPSG","8901"]],     UNIT["degree",0.0174532925199433,         AUTHORITY["EPSG","9122"]],     AUTHORITY["EPSG","4326"]])
Projection(wkt=GEOGCS["WGS 84",     DATUM["WGS_1984",         SPHEROID["WGS 84",6378137,298.257223563,             AUTHORITY["EPSG","7030"]],         AUTHORITY["EPSG","6326"]],     PRIMEM["Greenwich",0,         AUTHORITY["EPSG","8901"]],     UNIT["degree",0.0174532925199433,         AUTHORITY["EPSG","9122"]],     AUTHORITY["EPSG","4326"]])
Projection(wkt=PROJCS["WGS 84 / Pseudo-Mercator",     GEOGCS["WGS 84",         DATUM["WGS_1984",             SPHEROID["WGS 84",6378137,298.257223563,                 AUTHORITY["EPSG","7030"]],             AUTHORITY["EPSG","6326"]],         PRIMEM["Greenwich",0,             AUTHORITY["EPSG","8901"]],         UNIT["degree",0.0174532925199433,             AUTHORITY["EPSG","9122"]],         AUTHORITY["EPSG","4326"]],     PROJECTION["Mercator_1SP"],     PARAMETER["central_meridian",0],     PARAMETER["scale_factor",1],     PARAMETER["false_easting",0],     PARAMETER["false_northing",0],     UNIT["metre",1,         AUTHORITY["EPSG","9001"]],     AXIS["X",EAST],     AXIS["Y",NORTH],     EXTENSION["PROJ4","+proj=merc +a=6378137 +b=6378137 +lat_ts=0.0 +lon_0=0.0 +x_0=0.0 +y_0=0 +k=1.0 +units=m +nadgrids=@null +wktext +no_defs"],     AUTHORITY["EPSG","3857"]])
Projection(wkt=PROJCS["WGS 84 / UTM zone 33N",     GEOGCS["WGS 84",         DATUM["WGS_1984",             SPHEROID["WGS 84",6378137,298.257223563,                 AUTHORITY["EPSG","7030"]],             AUTHORITY["EPSG","6326"]],         PRIMEM["Greenwich",0,             AUTHORITY["EPSG","8901"]],         UNIT["degree",0.0174532925199433,             AUTHORITY["EPSG","9122"]],         AUTHORITY["EPSG","4326"]],     PROJECTION["Transverse_Mercator"],     PARAMETER["latitude_of_origin",0],     PARAMETER["central_meridian",15],     PARAMETER["scale_factor",0.9996],     PARAMETER["false_easting",500000],     PARAMETER["false_northing",0],     UNIT["metre",1,         AUTHORITY["EPSG","9001"]],     AXIS["Easting",EAST],     AXIS["Northing",NORTH],     AUTHORITY["EPSG","32633"]])
Projection(wkt=PROJCS["WGS 84 / UTM zone 33S",     GEOGCS["WGS 84",         DATUM["WGS_1984",             SPHEROID["WGS 84",6378137,298.257223563,                 AUTHORITY["EPSG","7030"]],             AUTHORITY["EPSG","6326"]],         PRIMEM["Greenwich",0,             AUTHORITY["EPSG","8901"]],         UNIT["degree",0.0174532925199433,             AUTHORITY["EPSG","9122"]],         AUTHORITY["EPSG","4326"]],     PROJECTION["Transverse_Mercator"],     PARAMETER["latitude_of_origin",0],     PARAMETER["central_meridian",15],     PARAMETER["scale_factor",0.9996],     PARAMETER["false_easting",500000],     PARAMETER["false_northing",10000000],     UNIT["metre",1,         AUTHORITY["EPSG","9001"]],     AXIS["Easting",EAST],     AXIS["Northing",NORTH],     AUTHORITY["EPSG","32733"]])
Reproject point, geometry or extent
from hubdc.core import *

utm = Projection.utm(zone=33)
wgs84 = Projection.wgs84()

point = Point(x=380000, y=5800000, projection=utm)
extent = Extent(xmin=380000, xmax=390000, ymin=5800000, ymax=5830000, projection=utm)
geometry = Geometry(wkt='POLYGON((380000 5830000,390000 5830000,390000 5800000,380000 5800000,380000 5830000))', projection=utm)

print(point.reproject(projection=wgs84))
print(extent.reproject(projection=wgs84))
print(geometry.reproject(projection=wgs84))
Prints:
from hubdc.docutils import createDocPrint

print = createDocPrint(__file__)

# START
from hubdc.core import *

utm = Projection.utm(zone=33)
wgs84 = Projection.wgs84()

point = Point(x=380000, y=5800000, projection=utm)
extent = Extent(xmin=380000, xmax=390000, ymin=5800000, ymax=5830000, projection=utm)
geometry = Geometry(wkt='POLYGON((380000 5830000,390000 5830000,390000 5800000,380000 5800000,380000 5830000))', projection=utm)

print(point.reproject(projection=wgs84))
print(extent.reproject(projection=wgs84))
print(geometry.reproject(projection=wgs84))
# END
Get projection
import enmapboxtestdata
from hubdc.core import *

rasterDataset = openRasterDataset(filename=enmapboxtestdata.enmap)
vectorDataset = openVectorDataset(filename=enmapboxtestdata.landcover_polygons)
extent = rasterDataset.extent()
point = extent.upperLeft()
geometry = extent.geometry()

# from raster dataset
projection = rasterDataset.projection()

# from vector dataset
projection = vectorDataset.projection()

# from extent
projection = extent.projection()

# from point
projection = point.projection()

# from geometry
projection = geometry.projection()
Reproject a vector dataset
import enmapboxtestdata
from hubdc.core import *

vectorDataset = openVectorDataset(filename=enmapboxtestdata.landcover_polygons)
vectorDataset.reproject(projection=Projection.wgs84(), filename='vector.gpkg', driver=GeoPackageDriver())
Reproject a raster dataset
import enmapboxtestdata
from hubdc.core import *

rasterDataset = openRasterDataset(filename=enmapboxtestdata.enmap)

# define target grid with extent of original raster, but in WGS 84 projection and 0.0001 degree resolution
grid = Grid(extent=rasterDataset.extent().reproject(Projection.wgs84()), resolution=0.0001)

# reproject raster into target grid
warped = rasterDataset.warp(grid=grid, filename='raster.bsq', driver=EnviDriver())
Export projection
from hubdc.core import *

projection = Projection.wgs84()

# to well known text
print(projection.wkt())

# to OSR spatial reference
print(type(projection.osrSpatialReference()))
Prints:
GEOGCS["WGS 84",
    DATUM["WGS_1984",
        SPHEROID["WGS 84",6378137,298.257223563,
            AUTHORITY["EPSG","7030"]],
        AUTHORITY["EPSG","6326"]],
    PRIMEM["Greenwich",0,
        AUTHORITY["EPSG","8901"]],
    UNIT["degree",0.0174532925199433,
        AUTHORITY["EPSG","9122"]],
    AUTHORITY["EPSG","4326"]]
<class 'osgeo.osr.SpatialReference'>
MapViewer
The map viewer is an interactive application for exploring maps.
View single map layer
Shortcuts for initialising a map viewer directly from a raster or vector dataset.
Multi band raster
import enmapboxtestdata
from hubdc.core import *
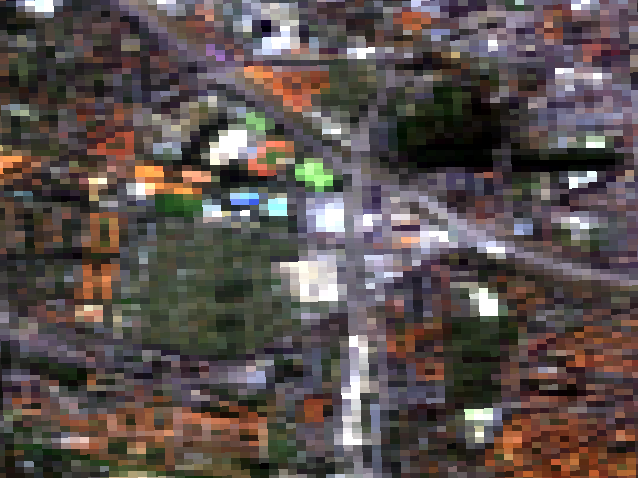
# Starting a map viewer from a multiband raster results in a MultiBandColorRenderer representation.
# Note that enmapboxtestdata.enmap has a default style defined (see .qml file next to it).
rasterDataset = openRasterDataset(filename=enmapboxtestdata.enmap)
MapViewer().addLayer(rasterDataset.mapLayer()).show()
Layer with MultiBandColorRenderer
Single band raster
# Starting a map viewer from a raster band results in a SingleBandGrayRenderer representation.
rasterBandDataset = rasterDataset.band(index=0)
MapViewer().addLayer(rasterBandDataset.mapLayer()).show()
Layer with SingleBandGrayRenderer
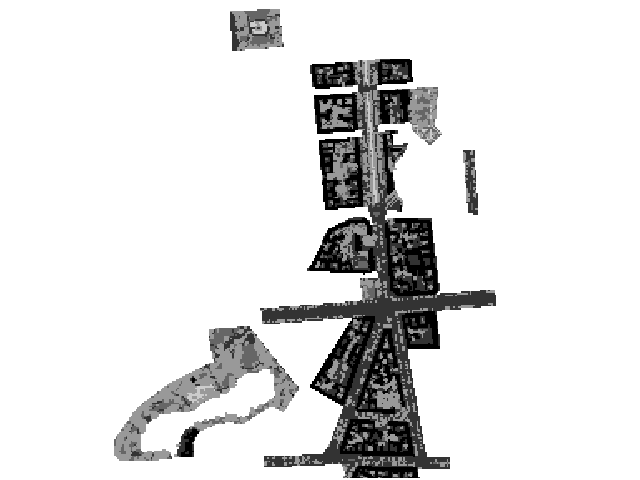
Vector
# Starting a map viewer from a vector results in a SingleSymbolRenderer representation by default.
# Note that enmapboxtestdata.landcover_points uses a CategorizedSymbolRenderer as default (see .qml file next to it).
vectorDataset = openVectorDataset(filename=enmapboxtestdata.landcover_points)
#vectorDataset.mapLayer().show()
#vectorDataset.mapViewer().show()
MapViewer().addLayer(vectorDataset.mapLayer()).show()
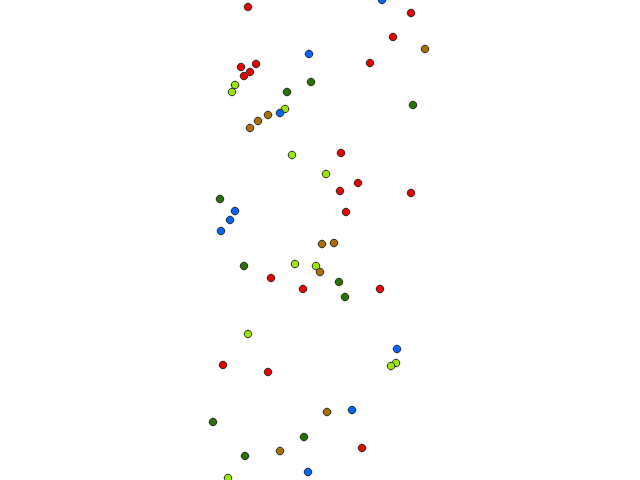
Layer with …
Paletted raster
# Starting a map viewer from a raster band with a color lookup table results in a PalettedRasterRenderer representation.
rasterDatasetWithLookupTable = openRasterDataset(enmapboxtestdata.createClassification(gridOrResolution=10, level='level_3_id'))
MapViewer().addLayer(rasterDatasetWithLookupTable.mapLayer()).show()
Layer with PalettedRasterRenderer
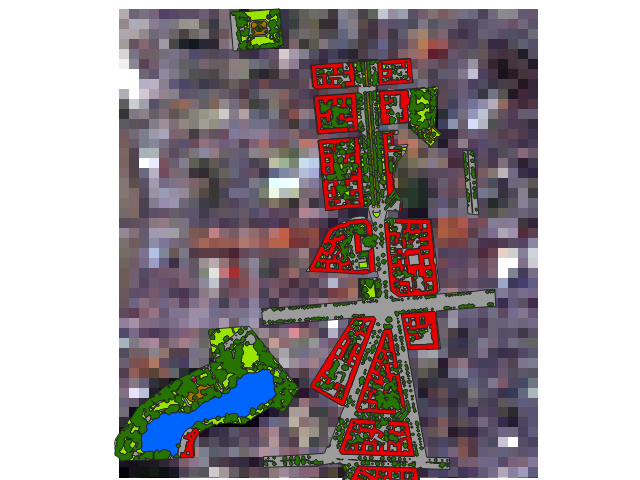
Add multiple map layer
import enmapboxtestdata
from hubdc.core import *

vectorDataset = openVectorDataset(filename=enmapboxtestdata.landcover_points)
rasterDataset = openRasterDataset(filename=enmapboxtestdata.enmap)

mapViewer = MapViewer()
mapViewer.addLayer(vectorDataset.mapLayer())
mapViewer.addLayer(rasterDataset.mapLayer())
mapViewer.show()
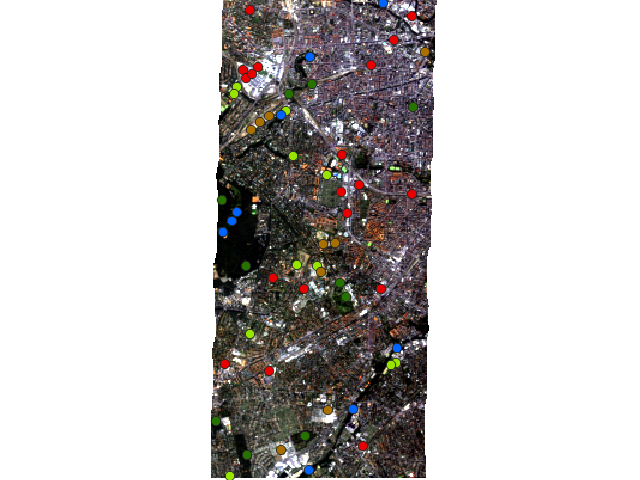
MapViewer with multiple map layer
Set viewer extent and projection
import enmapboxtestdata
from hubdc.core import *

rasterDataset = openRasterDataset(filename=enmapboxtestdata.enmap)

mapViewer = rasterDataset.mapViewer()

# change projection
mapViewer.setProjection(projection=Projection.wgs84())
mapViewer.show()
# change extent
mapViewer.setExtent(Extent(xmin=13.29, xmax=13.32, ymin=52.47, ymax=52.49, projection=Projection.wgs84()))
mapViewer.show()
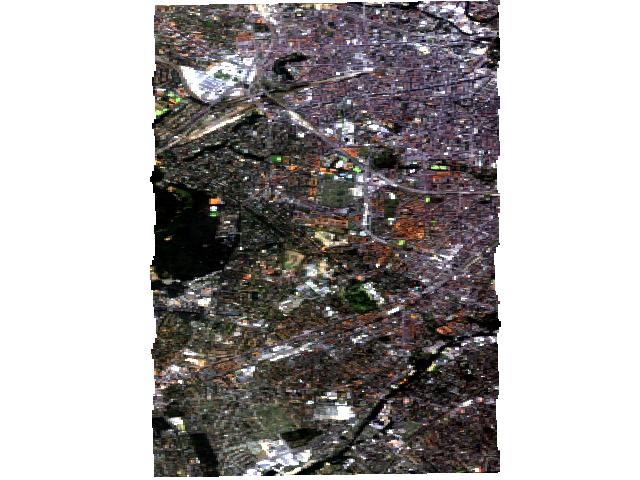
Rendering configuration
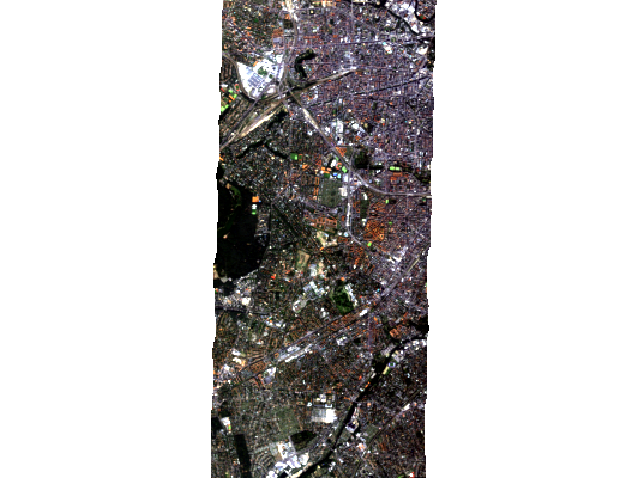
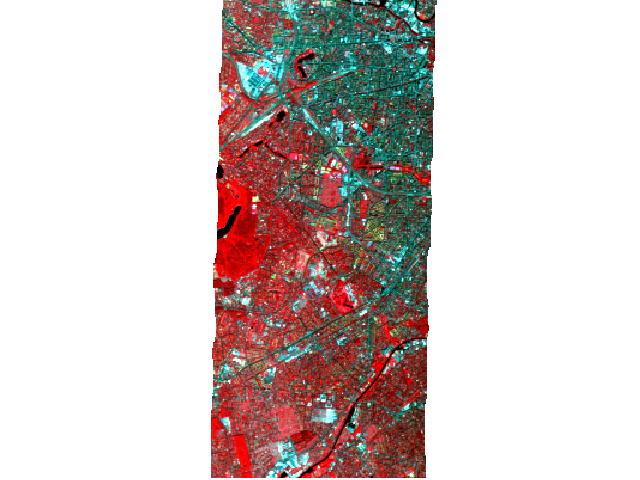
MultiBandColorRenderer
import enmapboxtestdata
from hubdc.core import *

# setup map viewer
rasterDataset = openRasterDataset(filename=enmapboxtestdata.enmap)
mapViewer = MapViewer()
mapLayer = rasterDataset.mapLayer()
mapViewer.addLayer(mapLayer)

# setup layer rendering

# - default is to apply a 2% - 98% stretch on the selected bands
mapLayer.initMultiBandColorRenderer(redIndex=63, greenIndex=37, blueIndex=23)

# - but it's also possible to set min-max stretch values explicitely
mapLayer.initMultiBandColorRenderer(redIndex=63, greenIndex=37, blueIndex=23,
                                    redMin=809, redMax=2861,
                                    greenMin=183, greenMax=1370,
                                    blueMin=279, blueMax=1275)

mapViewer.show()
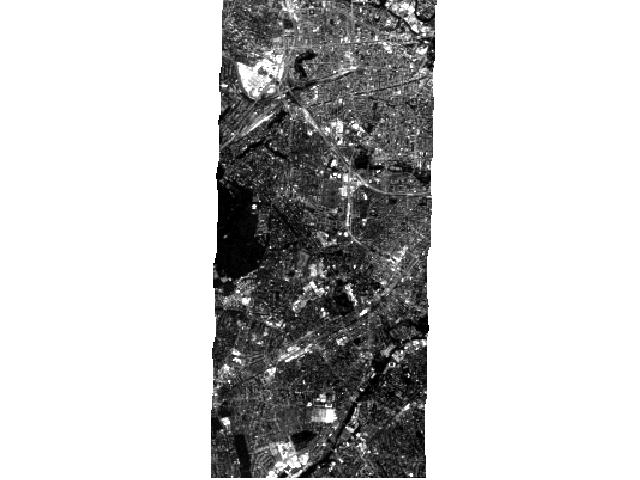
SingleBandGrayRenderer
import enmapboxtestdata
from hubdc.core import *
from qgis.core import QgsSingleBandGrayRenderer, QgsContrastEnhancement

# setup map viewer
rasterDataset = openRasterDataset(filename=enmapboxtestdata.enmap)
rasterBandDataset = rasterDataset.band(index=0)
mapViewer = MapViewer()
mapLayer = rasterDataset.band(index=0).mapLayer()
mapViewer.addLayer(mapLayer)

# setup layer rendering

# - default is to apply a 2% - 98% stretch on the selected band
mapLayer.initSingleBandGrayRenderer(grayIndex=0)

# - but it's also possible to set min-max stretch values explicitely
mapLayer.initSingleBandGrayRenderer(grayIndex=0, grayMin=179, grayMax=1026)

mapViewer.show()

PalettedRasterRenderer
Warning
todo
SingleSymbolRenderer
Warning
todo
CategorizedSymbolRenderer
Warning
todo
Save map viewer content to PNG file
import enmapboxtestdata
from hubdc.core import *

vectorDataset = openVectorDataset(filename=enmapboxtestdata.landcover_points)
rasterDataset = openRasterDataset(filename=enmapboxtestdata.enmap)

mapViewer = MapViewer()
mapViewer.addLayer(vectorDataset.mapLayer())
mapViewer.addLayer(rasterDataset.mapLayer())
mapViewer.save('image.png')